发表自话题:怎么画k线图
MATLAB里面自带了画K线的函数candle
自带函数效果预览图原始candle的使用方法语法描述输入参数修改源代码原始代码修改部分最终显示预览修改后的完整代码
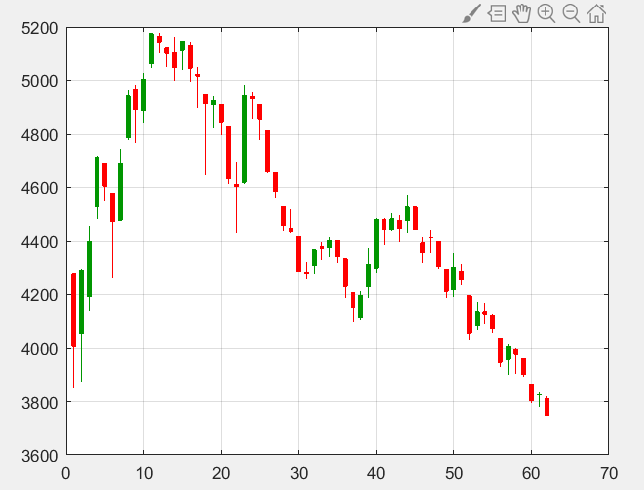
自带函数效果预览图

可以看出K线图有基本的框架,但是和我们平常的习惯不同,还需要修改其颜色,使得更直观些
原始candle的使用方法
语法
candle(Data)
candle(Data,Color)
h = candle(ax___)
描述
例子
candle(Data)从证券的一系列开盘价、最高价、最低价和收盘价中绘制蜡烛形图。如果收盘价大于开盘价,则主体(开盘价和收盘价之间的区域)未填充;否则主体被填充。
例子
candle(Data,Color)添加Color的可选参数.
例子
h = candle(ax___)为ax添加可选参数. 默认为gca,可选任意坐标轴
输入参数
Data=开盘价、最高价、最低价和收盘价数据
开盘价、最高价、最低价和收盘价的数据,指定为矩阵、表格或时间表。对于矩阵输入,Data 是存储在相应列中的开盘价、最高价、最低价和收盘价的M矩阵。
数据类型:double|table|timetable
color= (可选) 三个元素颜色矢量
图形窗口的背景颜色(默认) |颜色矢量[R G B] |字符串
三个元素颜色矢量,指定为[R G B]颜色矢量或指定颜色名称的字符串。默认颜色因图形窗口的背景颜色而异。
数据类型:double|string
修改源代码
原始代码
function varargout
= candle(varargin
)
%--------------------------- Parsing
/Validation
--------------------------%
try
narginchk(1,Inf
);
[ax
,args
] = internal
.finance
.axesparser(varargin
{:});
if ~isempty(ax
) && ~isscalar(ax
)
error(message('finance:internal:finance:axesparser:ScalarAxes'))
end
output
= internal
.finance
.ftseriesInputParser(args
, ...
4,{'open','high','low','close'},{},{},{'Color'},{''},{@
(x
)1,@ischar
},1);
catch ME
throwAsCaller(ME)
end
[data
,optional
,dates
,~] = output
{:};
op
= data(:,1);
hi
= data(:,2);
lo
= data(:,3);
cl
= data(:,4);
% Validation work will be left to child functions
.
color
= optional
.Color
;
%------------------------------ Data Preparation
-------------------------%
% Need to pad all inputs
with NaN's to leave spaces between day data
% Vertical High
/Low lines data preparation
.
numObs
= length(hi(:));
hiloVertical
= [hi lo
NaN(numObs
, 1)]'
;
indexVertical
= repmat(dates'
,3,1);
% Boxes data preparation
if isdatetime(dates
) && length(dates
) > 1
%If using datetimes
, make the box width one half
of the smallest
%distance between dates
inc
= 1/4 * min(diff(dates
));
else
inc
= 0.25;
end
indexLeft
= dates
- inc
;
indexRight
= dates
+ inc
;
%------------------------------- Plot
------------------------------------%
if isempty(ax
)
ax
= gca
;
end
% Store NextPlot
flag (and restore on cleanup
):
next
= get(ax
,'NextPlot');
cleanupObj
= onCleanup(@
()set(ax
,'NextPlot',next
));
backgroundColor
= get(ax
,'color');
if isempty(color
)
cls
= get(ax
, 'colororder');
color
= cls(1, :);
end
h
= gobjects(numObs
+1,1); % Preallocate
% Plot vertical lines
h(1) = plot(ax
,indexVertical(:),hiloVertical(:),'Color',color
,'AlignVertexCenters','on');
set(ax
,'NextPlot','add')
% Plot filled boxes
colorSet
= {backgroundColor
,color
};
% Filled the boxes when opening price is greater than the closing price
.
filledIndex
= ones(numObs
, 1);
filledIndex(op
> cl
) = 2;
try
for i
= 1 : numObs
h(i
+1) = fill(ax
, ...
[indexLeft(i
); indexLeft(i
); indexRight(i
); indexRight(i
)], ...
[op(i
); cl(i
); cl(i
); op(i
)],colorSet
{filledIndex(i
)},'Edgecolor',color
, ...
'AlignVertexCenters', 'on');
end
catch ME
throwAsCaller(ME)
end
switch next
case {'replace','replaceall'}
grid(ax
, 'on')
case {'replacechildren','add'}
% Do not modify axes properties
end
if nargout
% Not equal to
0
varargout
= {h
};
end
end
;
修改部分

1. 这里是输入参数的读取
2. 这里是单日数据的读取
由此可见,输入参数不管为多少个,只取前4个

1.这里是日期长度,后期画图plot需要的横坐标和纵坐标
2. 这里是画框需要的坐标点,后期画图fill需要的参数
3. 这里是坐标轴的设置,默认取当前axes
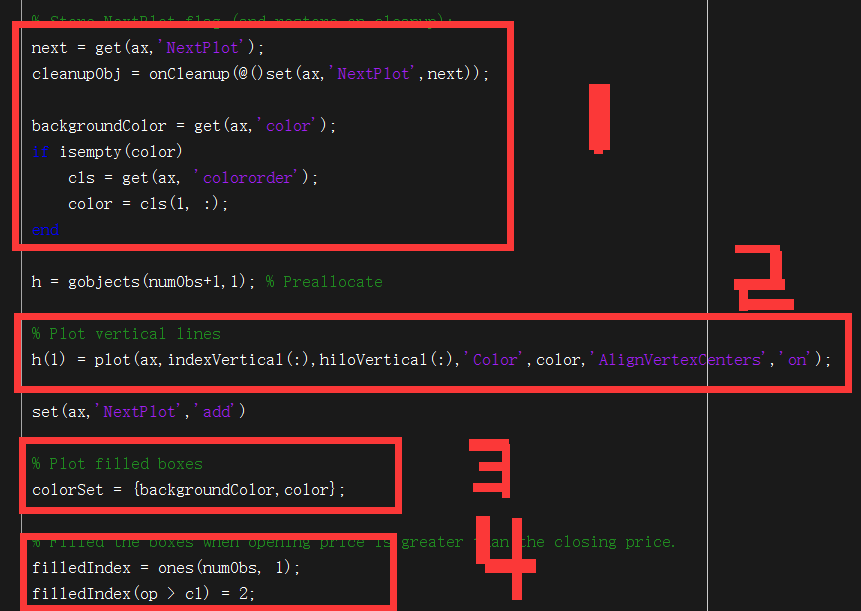
1. 这里是默认颜色的选取,可以不管
2. 这里是画直线的,也就是每天的最高价和最低价之间的细线,统一都是一种颜色,所以等会需要更
改,用两个plot分别画出不同颜色的细线
3. 这里是后面 fill 给框框填色的颜色选取,由前面的设置选取,需要更改
4. 这里是后面判断填色的依据
2处的修改
kk
=indexVertical(:,find(op
> cl
));
kkk
=hiloVertical(:,find(op
> cl
));
hh1
=plot(ax
,kk(:),kkk(:),'color',[0 150/255 0],'LineWidth',1,'AlignVertexCenters','on');
hold on
;
kk
=indexVertical(:,find(op
filledIndex(i
)},'Edgecolor',colorSet
{filledIndex(i
)}, ...
'AlignVertexCenters', 'on');
end
最终显示预览
好了,基本都已经修改完成了,代码也带着大家详细解读了,你可以根据自己的需求再更改其他的细节
修改后的完整代码
function varargout
= candle(varargin
)
%CANDLE Candlestick chart
.
%
% Syntax
:
%
% candle(Data
)
% candle(Data
,Color
)
% candle(ax
,___
)
%
% Description
:
%
% CANDLE plots a candlestick chart
from a series
of opening
, high
, low
,
% and closing prices
of a security
. If the closing price is greater than the
% opening price
, the
body (the region between the open and close price
)
% is unfilled
; otherwise the body is filled
.
%
% Input Argument
:
%
% Data
- A matrix
, table
, or timetable
. For matrix input
, Data is an
% M-by
-4 matrix
of opening
, high
, low
, and closing prices
.
% Timetables and tables
with M rows contain variables named
% 'Open', 'High', 'Low', and
'Close' (case insensitive
).
%
% Optional Argument
:
%
% ax
- Valid axis object
. The plot will be created
in the axes specified
% by ax instead
of in the current
axes (gca
). The option ax can
% precede any
of the input argument combinations
.
%
% Color
- Three element color vector
, [R G B], or a string specifying the
% color name
. The
default color differs depending on the background
% color
of the figure window
. See
COLORSPEC for additional details
.
%
% Output Argument
:
%
% h
- Graphic handle
of the figure
.
%
% See also
HIGHLOW, KAGI, LINEBREAK, POINTFIG, PRICEANDVOL, RENKO, VOLAREA.
% Copyright
1995-2018 The MathWorks
, Inc
.
%--------------------------- Parsing
/Validation
--------------------------%
try
narginchk(1,Inf
);
[ax
,args
] = internal
.finance
.axesparser(varargin
{:});
if ~isempty(ax
) && ~isscalar(ax
)
error(message('finance:internal:finance:axesparser:ScalarAxes'))
end
output
= internal
.finance
.ftseriesInputParser(args
, ...
4,{'open','high','low','close'},{},{},{'Color'},{''},{@
(x
)1,@ischar
},1);
catch ME
throwAsCaller(ME)
end
[data
,optional
,dates
,~] = output
{:};
op
= data(:,1);
hi
= data(:,2);
lo
= data(:,3);
cl
= data(:,4);
% Validation work will be left to child functions
.
color
= optional
.Color
;
%------------------------------ Data Preparation
-------------------------%
% Need to pad all inputs
with NaN's to leave spaces between day data
% Vertical High
/Low lines data preparation
.
numObs
= length(hi(:));
hiloVertical
= [hi lo
NaN(numObs
, 1)]'
;
indexVertical
= repmat(dates'
,3,1);
% Boxes data preparation
if isdatetime(dates
) && length(dates
) > 1
%If using datetimes
, make the box width one half
of the smallest
%distance between dates
inc
= 1/4 * min(diff(dates
));
else
inc
= 0.25;
end
indexLeft
= dates
- inc
;
indexRight
= dates
+ inc
;
%------------------------------- Plot
------------------------------------%
if isempty(ax
)
ax
= gca
;
end
% Store NextPlot
flag (and restore on cleanup
):
next
= get(ax
,'NextPlot');
cleanupObj
= onCleanup(@
()set(ax
,'NextPlot',next
));
backgroundColor
= get(ax
,'color');
if isempty(color
)
cls
= get(ax
, 'colororder');
color
= cls(1, :);
end
h
= gobjects(numObs
+1,1); % Preallocate
% Plot vertical lines
kk
=indexVertical(:,find(op
> cl
));
kkk
=hiloVertical(:,find(op
> cl
));
hh1
=plot(ax
,kk(:),kkk(:),'color',[0 150/255 0],'LineWidth',1,'AlignVertexCenters','on');
hold on
;
kk
=indexVertical(:,find(op
filledIndex(i
)},'Edgecolor',colorSet
{filledIndex(i
)}, ...
'AlignVertexCenters', 'on');
end
catch ME
throwAsCaller(ME)
end
switch next
case {'replace','replaceall'}
grid(ax
, 'on')
case {'replacechildren','add'}
% Do not modify axes properties
end
if nargout
% Not equal to
0
varargout
= {h
};
end
end
标签组:[matlab函数]
上一篇:如何用Python的pyecharts库绘制K线图
下一篇:python 获取股市数据 baostock + 画K线图 mpl_finance